![]() ISSN 0798 1015
ISSN 0798 1015

![]() ISSN 0798 1015
ISSN 0798 1015
Vol. 41 (Issue 10) Year 2020. Page 17
SUKESI 1; SUSILO, Daniel 2 & AKBAR, Wanda 3
Received: 29/11/2019 • Approved: 20/02/2020 • Published 26/03/2020
ABSTRACT: In the dynamic era of accelerating digital technology, the shift in people's behaviour is slow but sure from offline to online. No exception, digital transportation services are currently rife. The impact of the existence of application-based public transportation facilities on the economy of public users of public transportation; the economy of application-based taxi drivers, and on the economy of conventional taxi drivers of the era of digital technology acceleration. Online taxi drivers benefit because their income is far greater than before becoming an online taxi driver. While conventional drivers feel disadvantaged, because many people switch to using online taxis, so their income has decreased. It is hoped that the government will need to reformulate the rules and tariffs for online taxi operations, so as to improve the welfare of online taxi drivers, and protect the welfare of conventional taxi drivers, and not harm consumers |
RESUMEN: En la era de la aceleración de la tecnología digital, el cambio en el comportamiento de las personas en línea es lento. Sin excepción, los servicios de transporte com tecnología digital son actualmente abundantes. El impacto de la existencia de instalaciones de transporte público basadas en aplicaciones basan su economía en sus usuarios así como en taxistas utilizando aplicaciones para sus servicios hacen que los taxistas convencionales entren rápidamente en la tecnología digital. Los taxistas en línea se benefician porque sus ingresos son mucho mayores que cuando un servicio convencional. Actualmente los conductores convencionales se sienten en desventaja (ingresos menores) debido a que muchas personas han cambiado para usar aplicaciones de servicio de taxi. Se espera que el gobierno necesite reformular las reglas y tarifas para las operaciones de taxi en línea, a fin de mejorar el bienestar de todos los taxistas, tanto los que dan su servicio en línea y aquellos que siguen con el sistema convencional, y no perjudicar a los usuarios. |

Digital-based transportation contributes not only to the economy of the community but also to the government economy. The Demographic Institute of FEB UI conducted a study related to the impact of Go-Jek on the economy of Surabaya, that Go-Jek has contributed USD 14 million per year into the economy of Surabaya, (JP. May 5, 2018, p. 6). Nadim Makarim, boss of the Go-Jek group (in Matanajawa, May 20, 2018) said the Go-Jek group nationally contributed USD 5.2 Billion / yr from all members of the Go-Jek group and was the largest transportation application company in Southeast Asia.
This paper contains the first systematic evidence on Uber’s impacts In terms of income and jobs of conventional taxi drivers in the United States. Using the Uber platform's staggered roll-out across the 50 biggest Metropolitan Statistical Areas (MSAs), which we identify from freshly gathered information from a multitude of internet sources and press materials; we evaluate its effect on incumbent drivers from American Community Survey (ACS) samples. Our results show that the entry of Uber to a fresh industry on average led to a decrease in relative income among incumbent taxi drivers of about 10 percent. Estimated declines are greatest if we limit our sample of taxi drivers in the workforce, excluding self-employed drivers who after his partnership with Uber. When we study the development of hourly income, which is consistent with case study proof of sharp decreases, we generally receive comparable estimates in capacity utilization in traditional taxi services after Uber’s entry, presumably due to passengers increasingly shifting to Uber’s services as they become available (Cramer and Krueger, 2016). While our preferred interpretation of these estimates is that Uber’s introduction has depressed the demand for conventional taxi rides, which in turn the result was a decrease in earnings among incumbent drivers, an alternative explanation is that more productive drivers were exiting taxi workforce to partner with Uber. Yet, we find little evidence Changes in composition between drivers—in terms of, for example, age or educational attainment—after Uber’s entry, which largely reduces concerns that our results simply reflect a selective exit of more productive drivers (Berger et all 2018).
At present developments in the transportation industry are developing very rapidly. Every year there is a rise in the number of vehicles, both passenger vehicles, bus cars, freight cars, and motorbikes. Of the four modes of transportation, the A rise in the number of motorcycles from year to year is the highest. Data sourced from the Central Statistics Agency explained that the increase in the number of motorcycles from 2015 to 2016 was 6,268,815 units or an increase of 6.34% Indonesian Statistics. Below is a table of developments in the number of motorized vehicles from 2011 to 2016.
Table 1
Number of vehicles
Type |
2014 |
2015 |
2016 |
Passenger car |
12.599.038 |
13.480.973 |
14.580.666 |
Bus car |
2.398.846 |
2.420.917 |
2.486.898 |
Freight cars |
6.235.136 |
6.611.028 |
7.063.433 |
Motorcycle |
92.976.240 |
98.882.267 |
105.150.082 |
Source: Indonesian Statistic Centre 2017
The rise in motor vehicle numbers is certainly in line with the increase in traffic congestion in Indonesia, especially in big cities. So as to be in a position support the elevated mobility of the people, it is very necessary an effective mode of transportation to be able to avoid or reduce congestion. Urban transportation problems generally include traffic congestion, parking, public transportation, and pollution and traffic order issues. Traffic jams will always have negative effects, both on the driver itself and in terms of the economy and the environment. For vehicle drivers, congestion will cause tension (stress). It will also have a negative impact in terms of the economy in the shape of lost time due to long travel times and increased vehicle operating costs (gasoline, engine maintenance) due to frequent vehicle stops. In addition, there are also negative impacts on the environment in the shape of increased air pollution due to CO poison gas and an increase in vehicle noise . Brake pads and gas that are used in turn will cause additional air pollution and noise due to the roar of vehicle noise. Then to relieve stress, the drivers will more often use the horn to cause noise.
This article focuses on New York, the expansion of Uber quickly after its San Francisco and Los Angeles institution, among the different geographical regions where Uber expanded (Hall and Krueger, 2015). New York's yellow taxis they are commonly acknowledged as the representative icon of the city. Traffic congestion and pollution have been major problems in New York City for years due to the increasing number of vehicles on the road. Many laws and schemes have been implemented to solve the problem, such as imposing tolls, but traffic woes remain. Are one hundred MIT studies? (Alonso-Mora et al., 2017) Reviewed how to ride sharing could have an impact on the New York City transportation system such a technology-friendly company model with optimized algorithms could dramatically decrease traffic congestion by up to 75% (Kibum Kim ET all 2018).
In recent years, the economy of sharing has achieved a great deal of attention. Despite the shared services substantial growth, its overall impact on transport is unclear. This paper analyses the literature on transport sharing and includes reports from government and consultants, academic journals and websites. Ride sharing, car sharing, car sharing and car sharing drivers for participants are largely economic and convenience-related. Trust, Platforms of technology and the tendency to prevent asset ownership make growth easier. Potential barriers are over-regulation, inconsistent service quality and the need for recommendation. In particular, transport journals are relatively slow to investigate this topic with a greater focus on bike sharing than other vehicle sharing modes. The article describes the transportation effect of sharing, suggesting that it is likely to be part of a transportation problem and congestion solution in combination with other developments such as driverless vehicles. It also warns about the hazards of over-regulation and under-regulation. The future will require holistic transport strategies that take into account sharing options (Craig Standing ET all 2018).
In this chapter, we look at transportation sharing drivers. We do this by reviewing scholarly literature, consultancy reports, websites and blogs, and records from govt. The transport sharing economy is split into ride sharing, freight sharing, car pooling and car sharing and further evaluated according to the participants (Table 2). The following sections examine transportation facilitators and obstacles. One of the main drivers reported in the literature are economic in nature, for ridesharing for example participants find it a cost-effective way of travelling since it has created greater competition with the taxi industry and hence prices are often reported to be lower than conventional taxis, typically around 20% cheaper (Business Travel, 2016). Greater choice and its convenience (availability) are significant factors in use as well as the feeling of fun compared with engaging with traditional taxi firms (Deloitte, 2015). A Deloitte study (Deloitte, 2016) It was discovered that individuals were wasting another three minutes waiting for a taxi, with most Uber travellers picking up a taxi in about four and a half minutes compared to eight minutes. The study also discovered that Uber decreased ride-sharing hazards because both passengers and drivers have profiles that can be checked before pick-up.
Table 2
The drivers of sharing
related to transport
Model |
Party |
Drivers |
Transport Implication |
Ride-sharing |
Participant |
Affordability-reduced cost Owning feels like a burden Convenience-faster Choice Better for Environment More fun than engaging with traditional companies |
Government regulation required to protect consumers |
providers |
Income Independent- Self Employed Lack of conventional employment opportunities |
Potentially more vehicles offering service drives down prices |
|
Government |
Less traffic congestion Less spent on road infrastructure |
Government needs to develop position on relationship with ride-sharing companies |
|
Freight-sharing |
Participants |
Reduce costs Convenience-save time Alternative to owning |
Collaboration can reduce number of trucks on the road |
Car-pooling |
Participants |
Build community Better for Environment Reduced Cost |
Reduces Congestion and demand for parking |
Car-sharing |
Participant |
Affordability Owning feels like a burden Less expensive than to won |
May impact on reducing car ownership rates in cities |
Provider |
Profitable Taps into trend of not owning |
Vehicle manufacturers change to “mobility access providers” |
Source: Compiled by Author
In order to evaluate how ride sourcing changes the efficiency of urban transport and financial effectiveness in comparison with the status quo, it is crucial to define which mode of transport ride sourcing replaces – known as the modal change (Light, 2017). Ride sourcing competes most prominently with taxis. The amount of taxi journeys per month in San Francisco fell by more than half from March 2012 to July 2014. (San Francisco Municipal Transportation Agency, 2014). Taxi pickups in Manhattan, New York City; fell by 3.83 million from the same period in 2014. (Fischer-Baum & Bialik, 2015). Many academics and the popular press conducted comparative taxi and ride sourcing research (Anderson, 2014; Bialik, Flowers, Fischer-Baum, et al., 2015; Glöss, McGregor, & Brown, 2016), it all seemed that this important modal shift was confirmed. Another major shift in modalities caused by the emergence of public transit services (Rayle et al., 2016), although there are also circumstances where the provision of rides complements public transport networks (American Public Transportation Association, 2016).
The type of research used in this study is the explanatory survey type. The choice of this type depends on the type consideration that this type not only explains or illustrates empirical facts in the field but will also explain the analysis of influence (Bryman, 2007; Barnham, 2015). The unit of analysis in this study is all people of East Java who use online and conventional taxi. Furthermore, the respondents submitted statements in a questionnaire which is a translation of the indicators of the training and development system variables, work productivity variables, and employee competency variables. Data collection techniques used includes field studies, literature studies, and observational studies (Zikmund & William, 2003; Zyphur & Pierides, 2017).
This study uses quantitative analysis through the use of the path analysis method which is intended to determine the magnitude of the influence of Economic Development (X) variables on Community Economy (Y) through Online Transportation (Z) in the era of accelerating digital technology in East Java, which is described in the following hypothesis analysis model this:
Figure 1
Model of Hypothetical Analysis
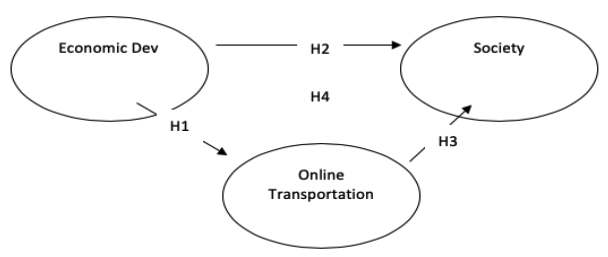
Based on Figure 1 above shows that there is several research hypotheses proposed, including:
H1: There is an Economic Development (X) to Online Transportation (Z) in the era of accelerating digital technology in East Java
H2: There is an influence of Economic Development (X) on Community Economy (Y) in the era of accelerating digital technology in East Java
H3: There is an influence of Online Transport (Z) Community Economy (Y) in the era of accelerating digital technology in East Java
H4: There is an influence of Economic Development (X) on Community Economy (Y) through Online Transportation (Z) in the era of accelerating digital technology in East Java
Validity shows the extent to which a measuring device that measures what you want measured (Zyphur & Pierides, 2017). Validity test in this study used a questionnaire item analysis by correlating the scores of each question item on the questionnaire with the total score which is the sum of each item score. The requirement that must be fulfilled, which must have these criteria, is that if the correlation coefficient rcount> rtable (0.246) then the item is declared valid. The validity test results can be seen in the following table 2:
Table 3
Test of Validity
Variable |
Item of Questionnaire |
rtable |
rcount |
Description |
Economic Development (X) |
X-Q.1 |
0,246 |
0,634 |
Valid |
X-Q.2 |
0,246 |
0,422 |
Valid |
|
X-Q.3 |
0,246 |
0,743 |
Valid |
|
X-Q.4 |
0,246 |
0,811 |
Valid |
|
X-Q.5 |
0,246 |
0,923 |
Valid |
|
X-Q.6 |
0,246 |
0,537 |
Valid |
|
X-Q.7 |
0,246 |
0,619 |
Valid |
|
X-Q.8 |
0,246 |
0,701 |
Valid |
|
X-Q.9 |
0,246 |
0,865 |
Valid |
|
X-Q.10 |
0,246 |
0,772 |
Valid |
|
Community Economy (Y) |
Y-Q.1 |
0,246 |
0,642 |
Valid |
Y-Q.2 |
0,246 |
0,848 |
Valid |
|
Y-Q.3 |
0,246 |
0,899 |
Valid |
|
Y-Q.4 |
0,246 |
0,941 |
Valid |
|
Y-Q.5 |
0,246 |
0,744 |
Valid |
|
Online Transportation (Z) |
Z-Q.1 |
0,246 |
0,831 |
Valid |
Z-Q.2 |
0,246 |
0,756 |
Valid |
|
Z-Q.3 |
0,246 |
0,793 |
Valid |
|
Z-Q.4 |
0,246 |
0,612 |
Valid |
|
Z-Q.5 |
0,246 |
0,549 |
Valid |
Source: Compiled by Author 2019
The results of this validity test show that all questions on the questionnaire have a calculated value of more than 0.246. Reliability tests are carried out on questions or statements that are already valid. This test is used to find out how far the measurement results remain consistent when measuring twice or more of the same symptoms using the same measuring device (Zyphur & Pierides, 2017). To see the reliability of each instrument using the Cronbach's alpha coefficient (α) where an instrument is said to be reliable if the Cronbach alpha value is greater than 0.600. The reliability test results showed that all research instruments had a Cronbach's alpha (α) coefficient of more than 0.600. This can be seen in table 3 below:
Table 4
Test of Reliability
Variable |
Limitation Value |
Cronbach’s Alpha (α) |
Description |
Economic Development (X) |
0,600 |
0,861 |
Reliable |
Community Economy (Y) |
0,600 |
0,938 |
Reliable |
Online Transportation (Z) |
0,600 |
0,829 |
Reliable |
Source: Compiled by Author 2019
Normality test is used to test whether the distribution of dependent variables for each value of certain independent variables is normally distributed or not (Barnham, 2015). In the linear regression model, this assumption is indicated by the value of error () which is normally distributed. A good regression model is a regression model that has a normal distribution or close to normal, so it is worth doing a statistical test. Testing the normality of data using the Kolmogorov-Smirnov Test of Normality where the basis for decision making can be done based on probability (Asymtotic Significance), i.e. if the probability> 0.05 then the distribution of the regression model is normal, and vice versa if the probability <0.05 then the distribution of the model regression is not normal. Can be seen in table 4 below:
Table 5
Test of Normality Using
Kolmogorov-Smirnov
Unstandardized Residual |
Kolmogorov-Smirnov Z |
Significancy Value |
Description |
Model A |
0,629 |
0,824 |
Normal Distributioned |
Model B |
0,684 |
0,793 |
Normal Distributioned |
Source: Compiled by Author 2019
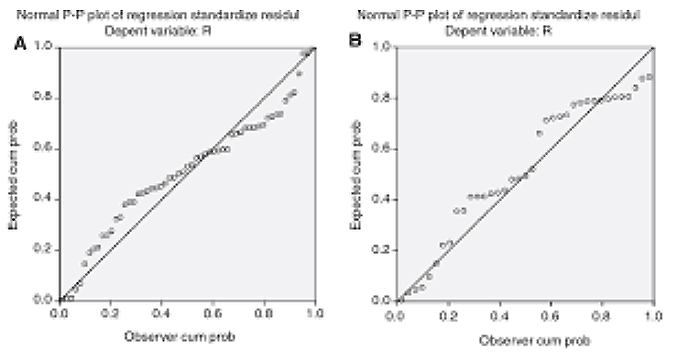
Based on table 4 above shows that the residuals of both models produce significance values of 0.824 and 0.793, respectively, both of which are of greater significance than the minimum significance value of 0.05. This concludes that the residuals of the two models are normally distributed and the normality test assumption is fulfilled. The normality of a variable is generally detected by graphs or statistical tests. The assumption of normality can be checked by checking the normal P-P plot output or normal Q-Q plot. The assumption of normality is fulfilled when the distribution of plot output points follows the plot diagonal line. Seen in the following picture 2:
Figure 2
Normal Probability Plot
on Model A and Model B
Source: Compiled by Author 2019
The aim of the heteroscedasticity test is to assess whether there is a difference between the residuals of one observation and another in the regression model (Barnham, 2015). If the variance from one observation to another is corrected, homoscedasticity is called, and if it is distinct, heteroscedasticity is called. A good regression model is a regression model that does not occur heteroscedasticity. The following are the results of heteroscedasticity testing:
Table 6
Test of Heteroscedasticity
Model |
Variable |
Rank Spearman Coefficient |
Significancy |
Description |
Model A |
Econoomy Development (X) Community Economy(Y) |
0,074 |
0,837 |
Non Heteroscedasticity |
Model B |
Online Transportation (Z) toward Community Economy (Y) |
0,061 |
0,489 |
Non Heteroscedasticity |
Source: Compiled by Author 2019
Based on table 5 above shows that the two models produce significance values respectively are 0.837 and 0.489 and the Spearman Rank coefficient of 0.074 and 0.061, where the significance value and the magnitude of the Rank Spearman coefficient are greater than 0.05. With the results of this department, the current economic development is greatly influenced by online transportation and impacts on the people's economy in Indonesia.
Seeing the development of online transportation outside and old local brands that are fantastic, the new local brands are still trying to find opportunities to be able to remain competitive, grow and survive in the midst of competition with big players. One of the opportunities is to master a specific market or niche market that hasn't been thought of or focused on by big players. New players can focus on becoming local champions in their respective regions considering that the big players are currently busier competing and providing subsidies in the capital. So that many users and drivers in the area are no longer getting large subsidies.
Actually, a specific market or niche market has been targeted by Go-Jek when facing its competitors, Uber and Grab, through Go-Box product innovation. Go-tix. Go-Med, Go-Glam, Go-Pay, Go-Send and soon. And this is a disruptive innovation that has been done by Go-Jek in developing its business. The presence of Go-Jek features has been a problem solver for the community towards what they want so far. Of course, with services that is safe, comfortable, profitable, and provide added value. So it is appropriate if until now the users of the Go-Jek application are increasing every year.
For all sectors today, disruptive innovation is a must. Even disruptive innovation has a very significant role to play in the internet transportation industry. Compete and survive in the sector to keep growing. Through these disruptive technologies:
1. Create a new market. This can be done by utilizing opportunities that have a common ground in certain aspects, for example, currently Go-Jek makes it easy for users of their applications to be able to access various needs that so far may be difficult to fulfil.
2. Focus on new markets, one form of company that has a focus on customers is trying to be able to always try to answer all needs and dismiss customer concerns. One way is to standardize the services provided.
3. Create and increase value for users, by providing the best subsidies. Certainty about competitive prices and tariffs is the added value of the company offered to customers.
4. To be Local Champion first and The National Champion soon. Trying to be a solution for the needs of the surrounding community, at the beginning of the existence of the Go-Jek in the city of big cities to deal with congestion problems, but not only in big cities now Go-Jek has also served the community in small cities in Indonesia
In creative industries like this everything can still happen. The main player who has become a market leader and has a large amount of capital might just fall to the most disruptive new players and provide the most important value desired or needed by users.
Transportation online have already made a significant impact on the taxi industry. These companies entered the market without the restrictions and regulations that serve as barriers of entry for traditional taxicab drivers. As a result, this advantage allows transportation online to operate with lower costs, and therefore provide better prices to consumers. Like all other service-oriented industries, the transportation industry is reliant upon consumer demand. Riders will always choose the service that provides them with a higher utility based on individual preferences. For transportation, the top three preferences are variations on speed, convenience, and low pricing.
In my side-by-side comparison on Uber, Lyft, Sidecar, and taxis, I found that transportation online often cut the wait time in half while charging a fraction of the price of a taxi service. With these results, it is obvious why transportation online have had such an immediate impact. Through the years, the employment of taxi drivers has fluctuated with changes in the economy. However, after the latest dip in employment in 2008-2010, it seems that some states rebounded better than others. Las Vegas, which banned Transportation online maintains a steady growth; other cities such as San Francisco and Los Angeles have taken a hit. Weighing the evidence, I make the prediction that Transportation online will eventually take over the taxi industry at current conditions. Despite the odds, traditional taxicabs have the power to stay competitive as long as changes are made regarding regulations and improved technology.
In future studies of the economics impact of transportation online on the taxi industry, I suggest using updated employment data. Due to the delay that comes with obtaining information, I could only use Bureau of Labour Statistics taxi employment data up to 2018. Uber, Lyft, and Sidecar, which are only a few years old, are likely to make a bigger impact in the years immediately following 2018. Taxi employment is expected to decrease as a result of a lower demand, and thus firms will need to cut labour costs. I also suggest a future econometric study using comparing transportation online and taxi data about the number of rides taken, wait times, pricing, and density of cars in a given region. This data is not currently available to the public, however upon the pending IPO, transportation online a will become a public company and thus information will be more accessible.
The economy of sharing has made an impact on transport in just a few years. The extent of the impact varies from country to country, city to city and between demographic groups. Estimating how it will progress in the future is a difficult task and is not just simply a case of extrapolating from how it has developed so far. The concept of the duality of technology explains how use of a technology evolves through time. Users appropriate technology according to the benefits they perceive it will provide, and as they adopt and use a technology they find new uses for them. This growth in use of a technology leads to further technological developments and the cycle of change and development continues. In other words, what people accept or embrace today will be different to what is acceptable in the future
Alonso-mora, J. et al. (2017) ‘On-demand high-capacity ride-sharing via dynamic trip-vehicle assignment’, in Proceedings of the National Academy of Sciences of the United States of America, pp. 462–467. doi: 10.1073/pnas.1721622115.
American Public Transportation Association (2016). Shared mobility and the transformation of public transit. Report, American Public Transportation Association. Retrieved from https://www.apta.com/resources/reportsandpublications/Documents/APTA-Shared-Mobility.pdf, Accessed date: 1 July 2019.
Anderson, D. (2014) ‘“ Not just a taxi ”? For-profit ridesharing , driver strategies , and VMT’, Transportation, 41(5), pp. 1099–1117. doi: 10.1007/s11116-014-9531-8.
Aziah, A. and Adawia, P. R. (2018) ‘Analisis Perkembangan Industri Transportasi Online di Era Inovasi Disruptif ( Studi Kasus PT Gojek Indonesia )’, Cakrawala-Jurnal Humaniora, 18(2), pp. 149–156.
Berger, T., Chen, C. and Frey, C. B. (2018) ‘Drivers of Disruption? Estimating the Uber Effect’, European Economic Review. Elsevier B.V., 110(November), pp. 197–210. doi: 10.1016/j.euroecorev.2018.05.006.
Bialik, C., Flowers, A., Fischer-Baum, R., et al. (2015). Uber is serving New York's outer boroughs more than taxis are. In: FiveThirtyEight. Retrieved from https://fivethirtyeight.com/features/Uber-is-serving-new-yorks-outer-boroughs-more-thantaxis-are/, Accessed date: 7 January 2019.
Bryman, A. and Emma B. (2007) Business Research Methods. 3rd Edition. Oxford: Oxford University Press.
Cramer, J. and Krueger, A. B. (2016) ‘Disruptive Change in the Taxi Business ’:, American Economic Review, 106(5), pp. 177–182.
Ford, H dan Kay B. (2015) Topik paling seru Ruang Angkasa, terj. Kandi Sekarwulan. Jakarta: Erlangga.
Glöss, M., Mcgregor, M. and Brown, B. (2016) ‘Designing for Labour : Uber and the On-Demand Mobile Workforce’, in Conference: the 2016 CHI Conference, pp. 1632–1643.
Hall, J. V and Krueger, A. B. (2018) ‘An Analysis of the Labor Market for Uber ’ s Driver-Partners in the United States’, ILR Review, 71(3), pp. 705–732.
Jawa Pos: Dampak Ekonomi Go-Jek di Surabaya Rp 192 M. Sabtu 05 Mei 2018, halaman 6
Jin, S. T. et al. (2018) ‘Ridesourcing , the sharing economy , and the future of cities’, Cities. Elsevier, 76(June), pp. 96–104. doi: 10.1016/j.cities.2018.01.012.
Kim, K., Baek, C. and Lee, J. (2018) ‘Creative destruction of the sharing economy in action : The case of Uber’, Transportation Research Part A. Elsevier, 110(May), pp. 118–127. doi: 10.1016/j.tra.2018.01.014.
Light, S. E. (2017) ‘Precautionary Federalism and the Sharing Economy’, Emory Law Journal, 66(2), pp. 333–394.
Nadim Makarim, bos Go-Jek group (di Matanajawa, 20 Mei 2018) menyampaikan kontribusi Go-Jek group sebagai perusahaan aplikasi transportasi terbesar se Asia Tenggara.
Rayle, L. et al. (2016) ‘Just a better taxi ? A survey-based comparison of taxis , transit , and ridesourcing services in San Francisco’, Transport Policy. Elsevier, 45, pp. 168–178. doi: 10.1016/j.tranpol.2015.10.004.
San Francisco Municipal Transportation Agency (2014). Taxis and accessible services division: Status of taxi industry. Report, San Francisco Municipal Transportation Agency Board Meeting, 16 September. Retrieved from https://www.sfmta.com/sites/default/files/agendaitems/9-16-14%20Item%2011%20Presentation%20-%20Taxicab%20Industry.pdf, Accessed date: 1 July 2018
Standing, C., Standing, S. and Biermann, S. (2019) ‘The implications of the sharing economy for transport’, Transport Reviews. Taylor & Francis, 39(2), pp. 1–17. doi: 10.1080/01441647.2018.1450307.
Watanabe, C., Naveed, K. and Neittaanmäki, P. (2016) ‘Co-evolution of three mega-trends nurtures un-captured GDP – Uber’s ride-sharing revolution’, Technology in Society. Elsevier Ltd, 46(August), pp. 164–185. doi: 10.1016/j.techsoc.2016.06.004.
Zikmund, William G. et.al. (2003). Customer Relationship Management: Integrating Marketing Strategy and Information Technology. New Jersey: John Wiley and Sons
1. Lecturer. Faculty of Economic and Business. Department of Management. Dr. Soetomo University. Indonesia
2. Lecturer. Communication Science. Dr Soetomo University. Indonesia. daniel.susilo@unitomo.ac.id
3. Student of Doctoral Program. Human Resource Development. Airlangga University. Indonesia
[Index]
revistaespacios.com

This work is under a Creative Commons Attribution-
NonCommercial 4.0 International License