Espacios. Vol. 36 (Nº 21) Año 2015. Pág. 7
National Innovation System of Ecuador: A New Perspective
Sistema Nacional de Innovación del Ecuador: Una Nueva Perspectiva
Byron ACOSTA 1; Prasanta KUMAR De 2
Recibido: 05/07/15 • Aprobado: 02/08/2015
Contenido
5. The Proposed National Innovation System of Ecuador
ABSTRACT: The paper proposes a structural design of the National Innovation Systems (NIS) of Ecuador after analyzing the achievements and limitations of the present system. It has been observed that the current NIS is not able to generate adequate thrust to enhance the technological competitiveness of the country to a certain threshold level to create more wealth and to further improve on the quality of life of the people. The paper looks into how various actors, like the network of institutions in the public and private sectors in the NIS, contributed towards this growth through their rules and procedures for the overall technological growth of the country. While the country is making significant progress in various areas, it has been observed that certain limitations like less interaction amongst the actors, as for example a very weak linkage with industry, have become impediments towards developing and adopting a robust NIS. |
RESUMEN: El objetivo de este artículo es proponer una nueva estructura del Sistema Nacional de Innovación (SNI) para Ecuador, después de analizar los logros y limitaciones del actual SNI. Se ha observado que la actual SNI no es capaz de generar el empuje adecuado para mejorar la competitividad tecnológica del país. En el documento se examinan cómo la red de instituciones de los sectores público y privado en el NSI han contribuido a este crecimiento a través de sus políticas y normas para el crecimiento tecnológico global del país. Mientras que el país está haciendo progresos significativos en diversas áreas, se ha observado ciertas limitaciones del SNI, como una menor interacción entre los actores, por ejemplo un vínculo muy débil con la industria. |
1. Introduction
Nelson & Rosemberg (1993), who has popularized the term "National Innovation System (NIS)", describes it as a network of institutions in the public and private sectors, whose interactions initiate, develop, modify and commercialize new technologies. In World Bank (2005) literature, it is mentioned that the innovation system of a country consists of the network of institutions, rules and procedures that affect how the country creates, acquires, disseminates and uses the knowledge. The innovation has become a central topic of policy makers as it plays a vital role on the income of the people, employment growth and the quality of life in general (FAGERBERG, 2006). Innovation is a collective and cumulative process involving several actors, many of which are external to a firm like the customers, suppliers, and many actors in the public and private sectors (FAGERBERG, 2006). To generate innovation and interdependence, there should exist interactions among organizations, and this is characteristics of the national innovation system (EDQUIST, 2005).
The national innovation system involves public and private institutions, whose activities and interactions promote, import and diffuse new technologies (FREEMAN, 1995). The aim of an NIS is to build an appropriate structure among firms – both public and private, universities, technical institutions, technology development centers, research institutes and venture capital firms (HAMIDI & BENABDELJALIL, 2013). All these participants of the innovation process take part in the development of the NIS, diffusion and usage of the resulting effects of the innovations (EDQUIST, 2005).
As per the Innovation Union Scoreboard (IUS), that captures the performance of the national innovation systems, some of the innovation leaders are Sweden, Denmark, Germany and Finland (EUROPEAN COMMISSION, 2014). These countries perform best on almost all dimensions, e.g. human resources, finance and support, research systems, firm investments, intellectual assets and entrepreneurship, and this reflects a balanced national research and innovation system (EUROPEAN COMMISSION, 2014). In 2011, the research intensity, i.e. the R&D expenditure as percentage of GDP, for these four countries was 3.2% on an average (EUROPEAN COMMISSION, 2014), and in the same year the research intensity for Ecuador was 0.35% (SENESCYT, 2014).
In another article, Marxt & Brunner (2013) analyzed how Switzerland can keep its leading position by enlarging and strengthening the national innovation system in a sustainable way. It was highlighted that one of the reasons for the success is the major focus on education and a high level of expenditure on education. Besides high overall expenditure on R&D, it is expressed that the R&D spending by private institutions is high (70%) as compared to the R&D expenditure by public institutions and other agencies. Hamidi & Benabdeljalil (2013) examined the architecture of the Moroccan NIS, its achievements and limitations. The authors identified that the low efficiency of Moroccan NIS is the weak interactions and coordination among various actors. Matei & Aldea (2012) evaluated the ranking of national innovation systems according to their technical efficiency. They have concluded that innovation leaders do not always have the most efficient innovation systems, and modest innovators are not necessarily inefficient in transforming innovation inputs into outputs.
Keeping in view the above, the aim of this research is to examine the architecture of the current national innovation systems of Ecuador, its achievements and limitations. While Ecuador has made significant progress in recent years, the paper looks into how various actors contributed towards the growth through their rules and procedures for the overall technological growth of the country. Section 2 presents the literature review addressing various general and technological aspects of NIS, and Section 3 mentions the methodology of the research. Section 4 presents the results covering the general and technology position of Ecuador, the current NSI of Ecuador, and the strengths and limitations of the present NIS. Section 5 gives the proposed NIS of Ecuador, and Section 6 presents the conclusions.
2. Literature Review
The national innovations system of a country encompasses the important economic, political, social, organizational, institutional and others factors that influence the development and diffusion of innovations (EDQUIST, 2005). The key components of the system are organizations like suppliers, customers, competitors, universities, schools and government ministries. The regulatory frameworks are like norms, routines, established practices, rules or laws that govern the relations and interactions among actors (EDQUIST, 2005). The NIS is influenced not only by the components but also by the relationship amongst them. The NIS relates between shared culture, values and institutions on the one hand, and learning, innovation and competitiveness on the other hand (FAGERBERG & SAPPRASERT, 2011). In a comprehensive literature review, Teixeira (2014) has cited various definitions and understanding of NIS by various researchers since 1980.
The NIS activities could be grouped into four levels, viz. (i) the knowledge inputs to the innovations process, (ii) the demand side factors, (iii) the provision of constituents of NIS, and (iv) the support services for innovating firms (EDQUIST, 2005). Table 1 shows the activities grouped in each level.
Table 1 . Activities in a National Innovation System
|
|
|
|
Source: Edquist (2005, p.190).
The NIS incorporates the key actors and activities in the knowledge production, and the absorption process indispensable for innovation to take place (POLENAKOVIK & PINTO, 2010). These key actors – public sector and private sector – have a specific role as 'knowledge creator' or 'knowledge user' (Figure 1 ). Each sector is characterized by a dominant issue in science, technology and innovation such as (i) the supply and demand (research capacity), (ii) the ability to innovative (social and human capital), (iii) the technology and innovator performance, and (iv) the capacity of market to absorb and diffuse innovations (absorptive capacity) (GUY & NAUWELAERS, 2003).
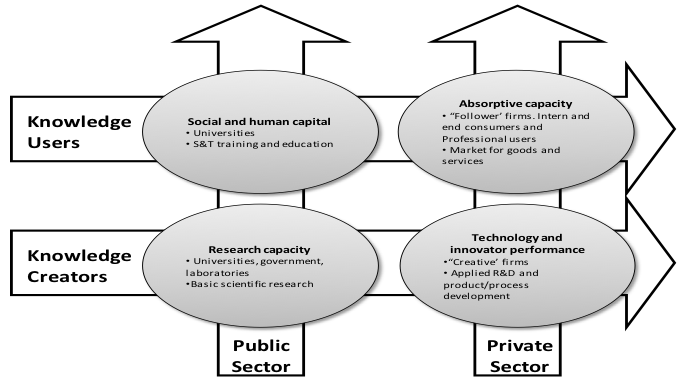
Figure 1 . Issues, actors and activities in Science, Technology and Innovation Systems
Source: Guy & Nauwelaers (2003).
An NIS perspective suggests that not only each of the constituent parts of the four sectors has to perform well if the system is to function effectively, but also all parts need to interact too (GUY & NAUWELAERS, 2003). The NIS incorporates all the activities and actors in the knowledge production and absorption processes that are necessary for industrial and commercial innovation to happen (DOHERTY, IRELAND, & ARNOLD, 2001). Figure 2 shows a conceptual model of a national innovation system.
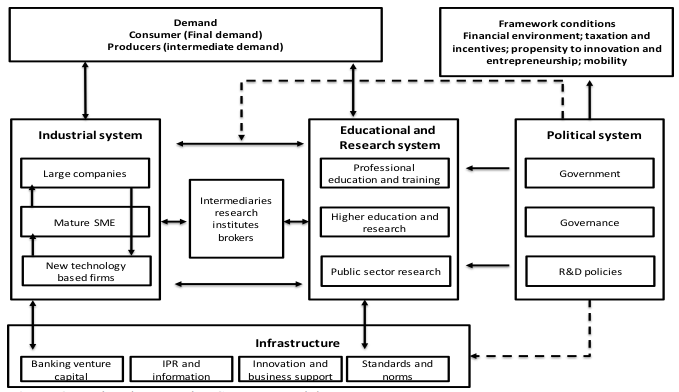
Figure 2 . National Innovation Systems Model
Source: Kuhlmann & Arnold (2001).
3. Methodology
In order to review the current status of NIS of Ecuador and to suggest a new structural design of NIS, the research strategies are: firstly to identify the profile of science, technology and innovation of Ecuador through secondary data; and secondly to conduct semi-structured interviews to managers of different organizations in different sectors related to production, planning, science, technology, research & development (R&D) and innovation. Visits have been made to different organizations in different sectors to have first-hand ideas about the present scenario of R&D and innovation in those organizations. The interviews were analyzed using content analysis to map the current NIS of Ecuador, and to identify its strengths and limitations. In the third step, a structural design of a new national innovation system of Ecuador has been made after analyzing the collected information. In the fourth step, recommendations have been given to improve on the system to develop a robust NIS for Ecuador.
4. Results
4.1. Country Profile of Ecuador: General
Ecuador, generally known as the Republic of Ecuador, has a government system in the nature of Representative Democratic Republic. It is a Latin American country located in South America bordering Columbia in north, Peru in east and south, and Pacific Ocean in the west. For long years the economy of Ecuador has been supported by the export of primary goods like petroleum crude, banana, shrimp, and flowers. Generally, industrial products did not have a significant component in the total gross domestic product (LUIS, 2008). The brief profile of the country is given in Table 2 .
Table 2 . Economic Profile
Population (Mn) (2013) |
16 |
Land Area (Sq. km.) (x 1000) |
248 |
GDP (Current US$ Bn) (2012) |
84 |
GDP per capita in US $ (2012) |
5,425 |
World GDP % (2012) |
0.117 |
Net FDI Inflow (US$ Mn) (2012) |
591 |
Foreign Exchange Reserve (US$ Bn) (2012) |
4.3 |
Ranking as per The Global Competitiveness Index 2013-14 out of 148 countries |
71 |
Source: World Bank (2014), World Economic Forum (2014)
The GDP and GDP growth rate of Ecuador can be seen in Figure 3 and Figure 4 respectively. It can be seen that from around 2000 onwards, the country is making a steady progress. The average GDP growth rate during 1984 and 2012 is 3.27%.
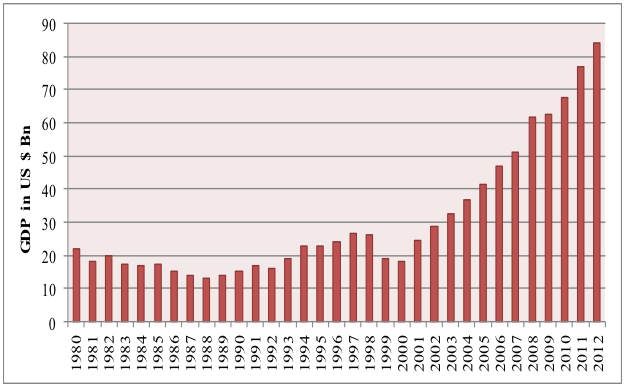
Figure 3 . GDP of Ecuador during 1890-2012
Source: World Bank (2014).
----
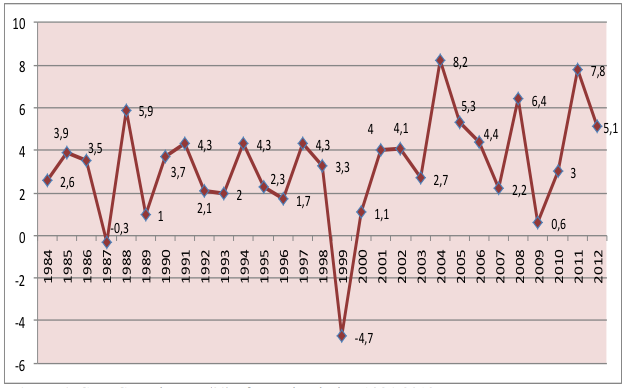
Figure 4 . GDP Growth Rate (%) of Ecuador during 1984-2012
Source: World Bank (2014).
4.2. Country Profile of Ecuador: Technological
The development of science and technology gained momentum from around 1950, and from that time various committees and development plans have been made to strengthen the technological base of the country. A brief technological profile of Ecuador is given in Table 3 .
Table 3 . Technological Profile
Patent Applications. Residents (Nos.) (2011) |
4 |
Patent Applications. Non-residents (Nos.) (2011) |
690 |
High technology Exports (% of manufactured exports) (2011) |
3.2 |
Research Intensity (% of GDP) (2005-2010 Average) |
0.26 |
Researchers in R&D (per million people) (Nos.) (2005-2010 Average) |
106 |
Source: World Bank (2014).
During 2009 to 2011, the R&D expenditure as percentage of Gross Domestic Product (GDP) in Ecuador is 0.38% (average) as compared to that of the innovation leaders like Sweden, Denmark, Germany and Finland that stands at an average of 3.36% (WORLD BANK, 2014) (Table 4 ).
Table 4 . R&D expenditure as a % of GDP
Country |
2009 |
2010 |
2011 |
Ecuador |
0.39 |
0.41 |
0.35 |
Finland |
3.94 |
3.90 |
3.78 |
Sweden |
3.60 |
3.39 |
3.78 |
Denmark |
3.16 |
3.07 |
3.09 |
Germany |
2.82 |
2.86 |
2.94 |
Source: SENESCYT (2014); World Bank (2014).
In Ecuador in 2011, the R&D expenditures by private sector is 49.2%, by the public sector is 32.5% and the balance is by the other sectors. In many countries, as shown in Table 5 , the private sector invests significantly more in R&D. In 2005, the business sector in Canada contributed with 97% of R&D expenditure, and the government with the remaining 3% (GERA, ROY, & SONGSAKUL, 2006).
Table 5 . GERD by source of funds (%)
Country |
Business Sector |
Governmental Sector |
Higher Education |
Non-profit |
Abroad |
Ecuador |
49.2 |
32.5 |
8.1 |
1.0 |
9.1 |
Finland |
67.0 |
25.0 |
0.1 |
1.3 |
6.5 |
Sweden |
57.3 |
27.7 |
0.9 |
3.0 |
11.1 |
Denmark |
60.3 |
28.9 |
Not available |
3.6 |
7.2 |
Germany |
65.6 |
29.8 |
Not available |
0.3 |
4.2 |
Source: SENESCYT (2014); EUROSTAT (2014).
Figure 5 shows the trend of the number of Ecuadorians articles published in scientific journals indexed in SCPOPUS from 1996 to 2012.
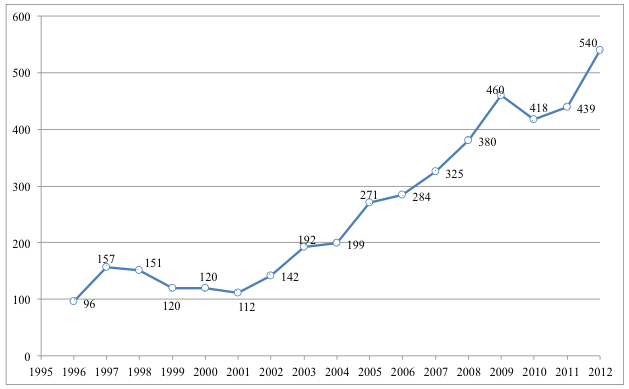
Figure 5 . Ecuadorians articles
Source: SCImago (2012).
Note: Data are citable documents including: articles, reviews and conference papers.
Figure 6 presents the percentage share of the number of Ecuadorians articles published in scientific journals indexed in SCOPUS in relation to Latin America and the World from 1996 to 2012.
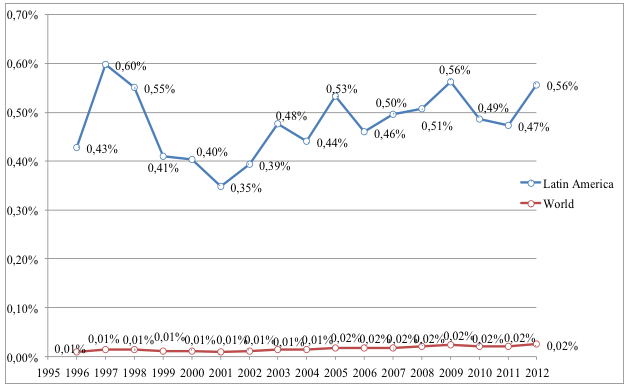
Figure 6 . Percentage of Ecuadorians articles in relation to Latin America and the World
Source: SCImago (2012).
Note: Data are citable documents including: articles, reviews and conference papers.
By analyzing the scientific publication data from 1996 to 2012 of Ecuador in relation to the major Latin America countries (Figure 7 ), a low scientific output is observed.
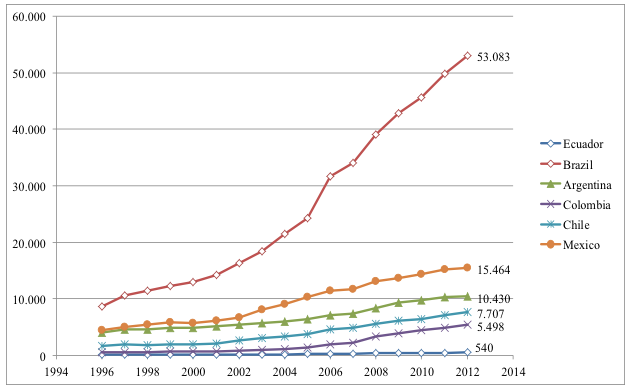
Figure 7 . Ecuadorians articles in relation to Latin America
Source: SCImago (2012).
If the scientific production is related with the Economically Active Population (EAP) of some Latin American countries, the resulting index is shown in Table 6. As for example, in 2012 Chile has 0.94 articles per thousand members of the EPA as compared to 0.07 for Ecuador.
Table 6. Scientific Publication vis-à-vis EAP
Country |
Number of Articles in 2012 |
Economically Active Population (EAP) (In thousands of people) |
Index |
a |
b |
c |
d = b / c |
Ecuador |
540 |
7387 |
0.07 |
Brazil |
53083 |
104745 |
0.51 |
Argentina |
10430 |
18850 |
0.55 |
Colombia |
5498 |
23107 |
0.24 |
Chile |
7707 |
8458 |
0.91 |
Mexico |
15464 |
52847 |
0.29 |
Source: SCImago (2012); World Bank (2014a).
While analyzing the focus in knowledge areas from 1996 to 2012 that contributes significantly to the scientific production in Ecuador are agricultural and biological sciences, medicine, and environmental science (Figure 8 ). These three areas cumulatively contribute to 53% of the scientific publication. This reflects less attention in some other important areas like engineering and Information & Communication Technology (ICT).
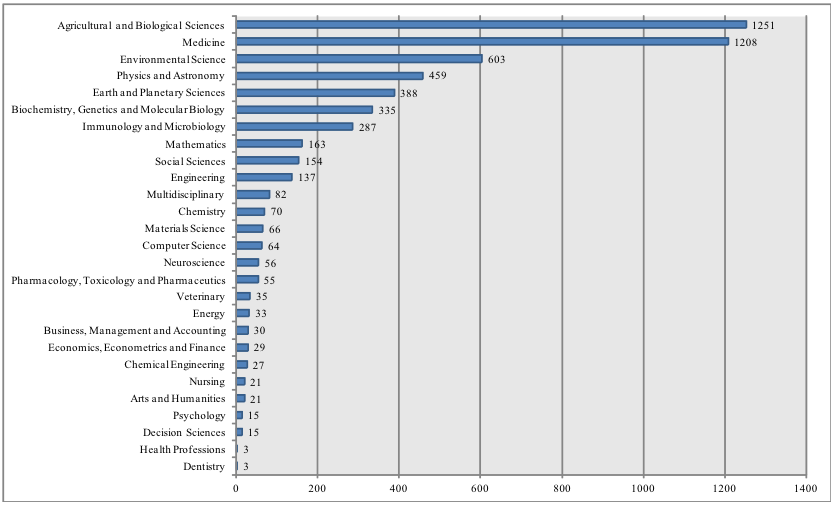
Figure 8 . Number of articles by knowledge area (1996-2012)
Source: SCImago (2012).
Note: Data are citable documents including: articles, reviews and conference papers.
4.3. The Present National Innovation System of Ecuador
The present national innovation system of Ecuador has been mapped after analyzing various information collected through different secondary data and interviews (Figure 9 ). Though it is difficult to show all detailed linkages in the system, effort has been put to project the best scenario. In the NIS of Ecuador, there are three broad levels, viz. political systems, support services or infrastructure, and education and research.
The political systems are headed by the government, more specifically by the Presidency and Vice-presidency of Ecuador. In this level, five ministries and a committee established by the National Congress interact for developing the broad objectives of the national innovation system. This level develops the legal framework and policies related to science, technology and innovation of the country. The guidelines and the framework enumerated in this level are disaggregated to various work plans in the second level.
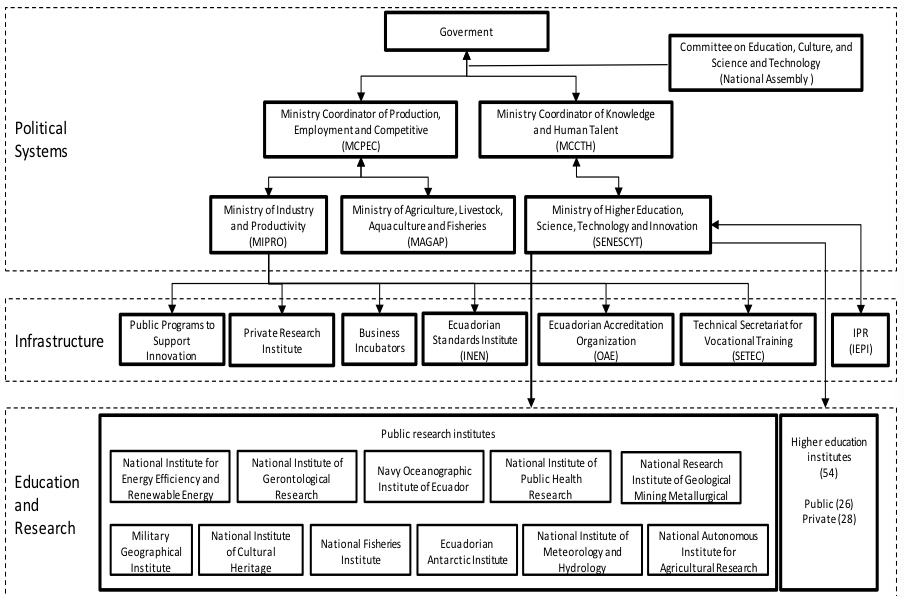
Figure 9. Current NIS of Ecuador
In the second level, there are seven actors, six of whom work under the guidance of the Ministry of Industry and Productivity, and one under the Ministry of Higher Education, Science, Technology and Innovation. The actors in this level encourage the introduction of innovations through funding for innovation, knowledge transfer, training, and information resources.
In the last level of the national innovation system, there are public research institutes, and higher education institutes. At present, there are 11 public research institutes covering a wide spectrum of areas of science and technology, and 54 higher education institutes – out of which 26 are public institutes and 28 are private institutes. The ministry of higher education, science, technology and innovation coordinates all these actors.
4.4. Strengths and Limitations of Present NIS of Ecuador
It is felt that the present national innovation system of Ecuador is not able to generate the required thrust to enhance the technological competitiveness to a certain threshold level to create more wealth and to further improve on the quality of life of the people of the country. While there are various strengths in the national innovation system, due to some inherent limitations of the system, the NIS of Ecuador is not able to deliver the best out of the system. Some of the strengths of the system can be highlighted as:
- Stable political environment and good macroeconomic growth.
- Presence of promising entrepreneur to develop fast-growing companies.
- Good progress in socio-economic aspects.
- Good streamlining of regulatory framework.
- Progressive plan to reform the educational system.
While the country is making significant progress in various areas, it has been observed that certain limitations have become impediments towards developing and adopting a robust national innovation system in Ecuador. Some of them are:
- Weak link among various actors in the national innovation system, particularly the weakest link between industry and other actors in the system. Industry, both public and private, needs to play a vital role in the overall invention-innovation-diffusion chain.
- Less focus in diffusion of technology resulting in less transformation of innovation into ultimate usage in the market.
- The overall expenditure on research and development in Ecuador can be increased, preferably with substantial annual increases.
- The academia-industry interaction needs to be closer.
- The functional approach in organizing and monitoring the innovation aspects among various actors can be made clearer. The coordination and communication process can be made more effective. There can be clearly-identified one coordinating agency for the innovation policy.
- The human talent towards science, technology and engineering needs to be upgraded. More attention towards academic research in respect of doctoral and post-doctoral studies is required.
- Focus on basic and industrial research needs more attention. Infusion of experienced talent into the system will maximize the talent utilization.
- The learning process of the people involved in the innovation process can be continued. Without certain competency level, the adoption and adaptation of superior and high-level technology will be difficult.
- Suitable priorities can be set in the innovation policy.
- The execution time of the development agenda in NIS can be expedited.
- There can be more active technology incubators, technology parks and specialized economic zones in the country.
- Public-Private-Partnership (PPP) can be actively incorporated into the system with adoption of superior technology.
- Suitable incentive system can be designed to encourage the overall system, and at the same time the non- or less-performers need to be discouraged.
By the factors described above, the current NIS of Ecuador has a weak technological capacity. The idea that the gap in the development of countries are principally caused by technological differences (FAGERBERG & SRHOLEC, 2008). For countries in the process of minimizing the gap, the appropriate level of technological capability will directly affect the development and consolidation of its innovation system.
5. The Proposed National Innovation System of Ecuador
To alleviate some of the limitations of the present national innovation system of Ecuador, attempt has been made to develop a national innovation system that will streamline the operational flow of the invention-innovation-diffusion process of the national innovation system of Ecuador. The proposed national innovation system has been presented in Figure 10 .
The university education can add significant value to the National Innovation System of Ecuador primarily in three different ways. Firstly, the quality and quantity of the talent pool generated by the university to enhance the absorptive capacity is vital for the National Innovation System of Ecuador. The NIS will not be able to deliver without a strong higher education base. Some of the focus areas can be engineering, biotechnology and information technology and communication (ICT). Secondly, university research would generate substantial innovation through inventions, and this will add value to the NIS of Ecuador. Thirdly, university research centers act as a major link between industry and academics for ultimate technology diffusion in the invention-innovation-diffusion process.
The proposed national innovation system has the following major advantages:
- Streamlining the operational flow with clear scope of responsibility of different participants in the national innovation system of Ecuador. The proposed system will reduce the overlap of activities to the minimum.
- To make industry as an active actor in the NIS.
- The proposed system connects the knowledge creators to knowledge users more effectively through technology diffusion.
It is to highlight that an efficient national innovation system by design as such cannot deliver unless it is executed effectively. It may be difficult to incorporate some changes necessitated to rejuvenate the NIS, particularly when some of the changes are significant. The country should take a firm steps to implement the new system.
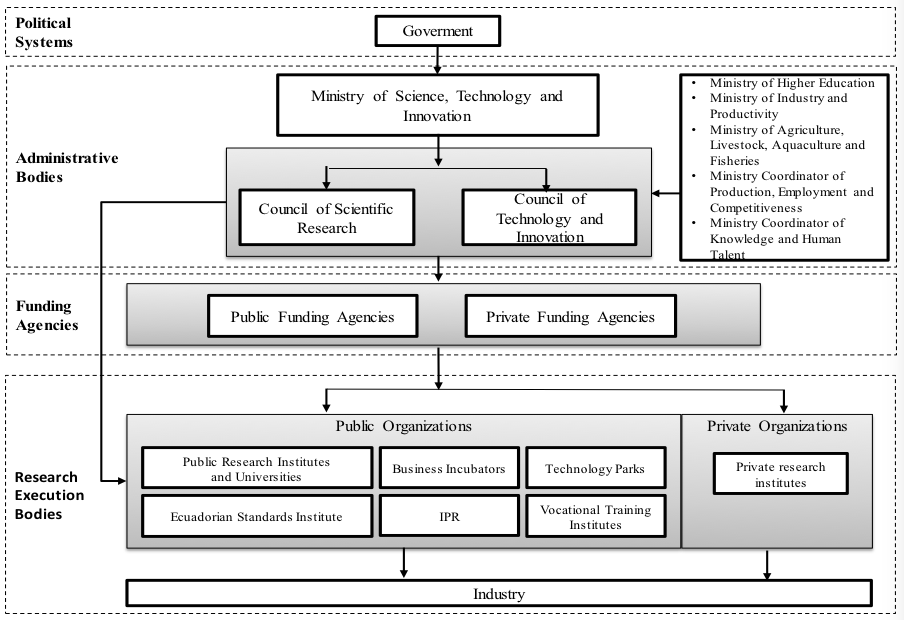
Figure 10. Proposed NIS of Ecuador
6. Conclusions
It has been observed that the present national innovation system of Ecuador is not able to generate the required thrust to enhance the technological competitiveness of Ecuador. While Ecuador has made significant progress in last 5-7 years, the paper looks into how various actors in the national innovation system contributed towards the overall technological growth of the country. It has been observed that certain limitations have become impediments towards developing and adopting a robust national innovation system in Ecuador. Countries that do not succeed in developing suitable technological capabilities and other complementary factors must be expected to continue to lag behind.
The paper proposes a structural design of the National Innovation Systems (NIS) of Ecuador after analyzing the achievements and limitations of the present national innovation system of the country. While highlighting various strengths and limitations of the present national innovation system, suggested measures have been given to make the NIS of Ecuador more effective. Further detailed research work can be carried out to make the recommendations more specific and exact
References
Doherty, D. O., Ireland, I., & Arnold, E. (2001). Understanding Innovation : the need for a systemic approach. The IPTS Report, 2(71), 7–10. Retrieved from http://ipts.jrc.ec.europa.eu/home/report/english/articles/vol71/TEC3E716.htm
Edquist, C. (2005). Systems of Innovation, Perspectives and Challenges. In J. Fagerberg, D. Mowery, & R. Nelson (Eds.), The Oxford Handbook of Innovation (1st ed., pp. 181–208). New York, New York, USA: Oxford University Press.
European Commission. (2014). Innovation Union Scoreboard 2014. Brussels.
EUROSTAT. (2014). GERD by source of funds. Retrieved April 9, 2014, from http://epp.eurostat.ec.europa.eu/portal/page/portal/science_technology_innovation/data/database
Fagerberg, J. (2006). What do we know about innovation and socio-economic change? Lessons from the TEARI project. In L. Earl & F. Gault (Eds.), National Innovation Indicators And Policy (New Horizons in the Economics of Innovation) (1st ed., pp. 11–23). Northampton: Edward Elgar Publishing. Inc.
Fagerberg, J., & Sapprasert, K. (2011). National innovation systems: the emergence of a new approach. Science and Public Policy, 38(9), 669–679. http://doi.org/10.3152/030234211X13070021633369
Fagerberg, J., & Srholec, M. (2008). National innovation systems, capabilities and economic development. Research Policy, 37(9), 1417–1435. http://doi.org/10.1016/j.respol.2008.06.003
Freeman, C. (1995). The ' National System of Innovation ' in historical perspective. Cambridge Journal of Economics, 19, 5–24.
Gera, S., Roy, R., & Songsakul, T. (2006). The role of benchmark and targets in Canadian innovation policy. In L. Earl & F. Gault (Eds.), National Innovation Indicators And Policy (New Horizons in the Economics of Innovation) (1st ed., pp. 24–68). Northampton: Edward Elgar. Retrieved from http://www.qut.eblib.com.au.ezp02.library.qut.edu.au/EBLWeb/patron/
Guy, K., & Nauwelaers, C. (2003). Benchmarking STI Policies in Europe: In Search of Good Practice. The IPTS Report, 2(71), 20–28. Retrieved from http://ipts.jrc.ec.europa.eu/home/report/english/articles/vol71/TEC2E716.htm
Hamidi, S., & Benabdeljalil, N. (2013). National Innovation Systems: The Moroccan Case. Procedia - Social and Behavioral Sciences, 75, 119–128. http://doi.org/10.1016/j.sbspro.2013.04.014
Marxt, C., & Brunner, C. (2013). Analyzing and improving the national innovation system of highly developed countries — The case of Switzerland. Technological Forecasting and Social Change, 80(6), 1035–1049. http://doi.org/10.1016/j.techfore.2012.07.008
Matei, M. M., & Aldea, A. (2012). Ranking National Innovation Systems According to their technical Efficiency. Procedia - Social and Behavioral Sciences, 62, 968–974. http://doi.org/10.1016/j.sbspro.2012.09.165
Nelson, R., & Rosemberg, N. (1993). Technical Innovation and National Systems. In R. Nelson (Ed.), National Innovation System - A Comparative Analysis. New York: Oxford University Press.
Polenakovik, R., & Pinto, R. (2010). The national innovation system and its relation to small enterprises: The case of The Republic of Macedonia. World Journal of Science, Technology and Sustainable Development, 7(1), 91–107. http://doi.org/10.1108/20425945201000007
SCImago. (2012). SJR - Country Search. Retrieved May 6, 2014, from http://www.scimagojr.com/countrysearch.php?country=BR
SENESCYT. (2014). ENCUESTA NACIONAL DE ACTIVIDADES DE CIENCIA Y TECNOLOGÍA 2009 – 2011. Quito.
World Bank. (2005). India and the Knowledge Economy: Leveraging Strengths and Opportunities" WBI Development Studies. (C. Dahlman & A. Utz, Eds.). Washington DC: The International Bank of Reconstruction and Development.
World Bank. (2014a). Población activa, total. Retrieved June 11, 2014, from http://datos.bancomundial.org/indicador/SL.TLF.TOTL.IN
World Bank. (2014b). Research and development expenditure (% of GDP). Retrieved April 9, 2014, from http://data.worldbank.org/indicator/GB.XPD.RSDV.GD.ZS?order=wbapi_data_value_2011 wbapi_data_value wbapi_data_value-last&sort=desc
World Economic Forum (2014). The Global Competitiveness Report 2013–2014, Geneva, Switzerland.
1. Ph.D. Secretaría de Educación Superior, Ciencia, Tecnología e Innovación - SENESCYT, Prometeo Researcher, Whymper E7-98 y Pasaje Donoso, Edf. Tempo, Piso 1, Quito, Ecuador Email: byron@hotmail.com.br
2. Ph.D. Secretaría de Educación Superior, Ciencia, Tecnología e Innovación - SENESCYT, Whymper E7-98 y Pasaje Donoso, Edf. Tempo, Piso 1, Quito, Ecuador Email: kprasanta@senescyt.gob.ec